8.Grandma’s books
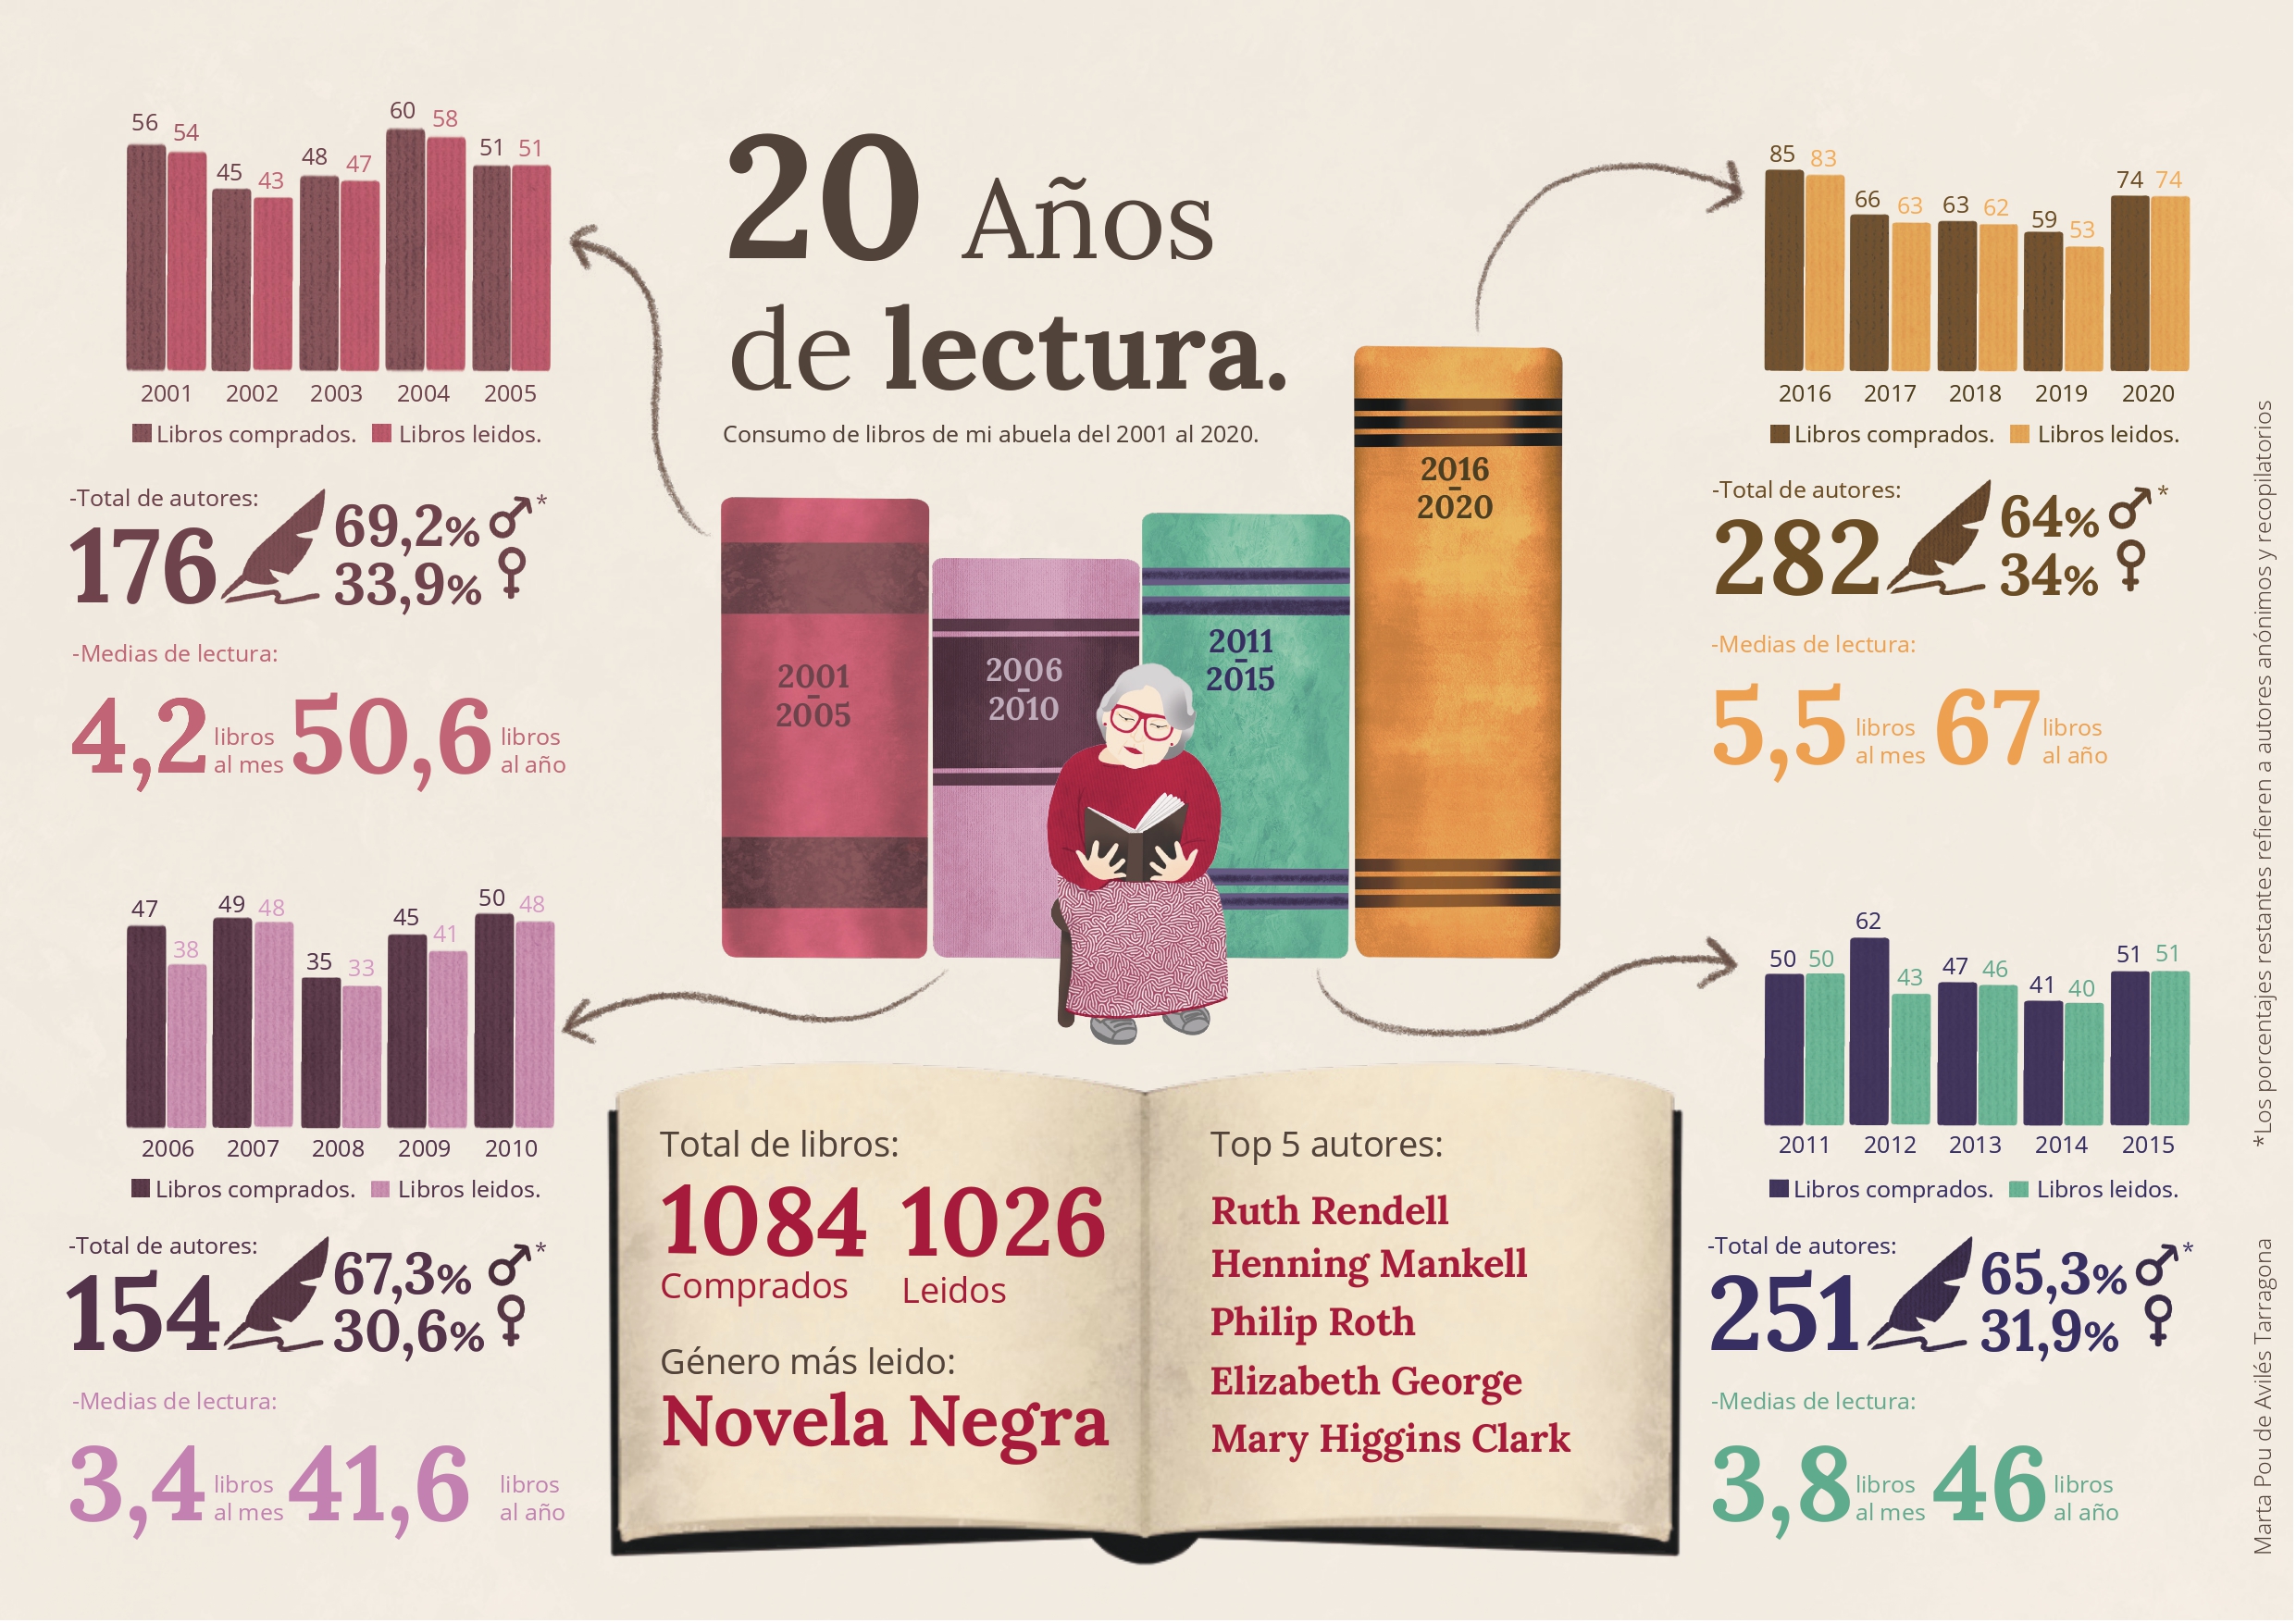
Infographic about my grandma's book consumption during the last 20 years
In my context and user class at university, we were asked to create an infographic reflecting the consumption of one item by someone in our family. I immediately thought of my grandmother, who is probably the person that I know that reads the most. When talking to her about the assignment, she told me that she kept an excel file where she wrote down all the books she had bought since 1998, with their name, author, and whether she read them or not. Some of them even had reviews.
So I decided to create this infographic reflecting the books she had bought between the years 2000 and 2020. I carefully went through each one of the titles that were featured on the list and classified the different genres, whether the author was a man or a woman… I decided to portray all this information in four blocks, formed by the books she bought each consecutive five years, and also a more general overview of the hole. I also made several illustrations to accompany the information and also help visualize it (as done with the different heights of the books that form a bar chart in the middle).
Assignment for my “Context and User” class
2nd year of ELISAVA’s Interaction Design degree, 2020
2nd year of ELISAVA’s Interaction Design degree, 2020